I have been a casual reader of Jonathan’s Space Report since 2017, so natrually when I wanted to plot active sats over time, his data was the first that came to mind.
Recently, I learned that he plans to retire this year, move back to the UK, and dedicate more time to the Space Library project. He’s currently running a fundraiser on GoFundMe. (I donated $100 - go check it out!)
A Plot I like
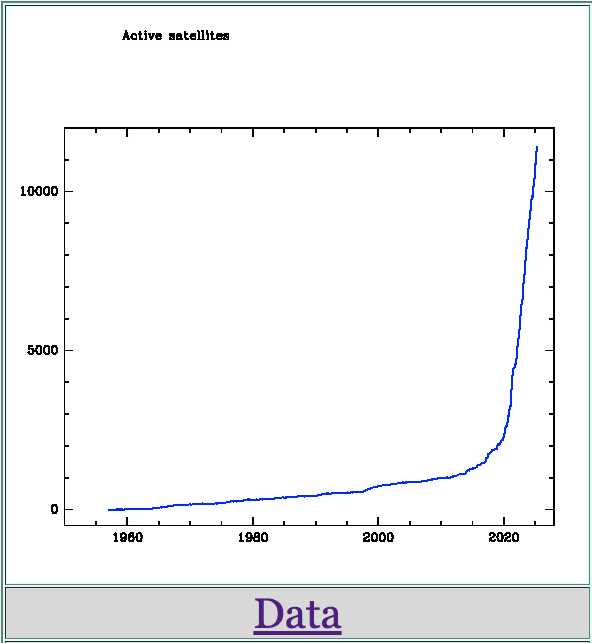
Plot: GCAT Stats (J. McDowell, planet4589.org/space/stats)
My Take on This
I have been flipping through The Visual Display of Quantitative Information by Edward Tufte (and this online post) and Effective Visualization by Matt Harrison — just glancing for now. I love sparklines. Tufte describes them as "data-intense, design-simple, word-sized graphics." They focus only on the data — what he calls "data-ink." That idea stuck with me.
This was my attempt to imitate that style.
I picked dates that are meaningful to me. I first got interested in the space industry after seeing the Falcon 9 soft landing — that was right before my Penn State graduation. Later, I attended the International Space University, with my grad ceremony in June 2022. I included Sputnik because that’s where it all started.
Between 2014 and now, the number of active satellites has grown nearly 10x. From 2022 to now, it has doubled. I wanted to highlight that.
The sparkline shows the growth clearly, and the table on the right frames it with those key dates and values. I used an orange accent to highlight the most recent number — just enough to catch the eye.
Final Thoughts
I learned a lot through this exercise — both about the data and how to present it clearly. I’d like to build on this by adding more sparklines below the current one to track other parts of the NewSpace industry.
To do that, I’ll need to think more about which indicators actually matter. Just like asset managers follow financial and economic signals, I want to find meaningful metrics for space. Ideally, ones with real-world applications — not just plots for their own sake.
What do you think?